Qwen3.8-27B on an RTX 3090: results, metrics and limits
A complete record of one home experiment with Qwen3.8-27B: serving profile, timings, tokens, energy, VRAM, coding tests, failures and limits.
We measured local Qwen on coding tasks and long context. The result includes failures, the serving profile and the scoring method.
Syntalith
One RTX 3090 with 24 GB of VRAM was enough to run Qwen3.8-27B and repair two Go paths that ignored json.Marshal errors. Qwen Code preserved successful responses and added serialization-failure handling, regression tests and documentation.
The run took 502.14 seconds, 52 tool calls and 28,916 generated tokens. Energy use was about 33.88 Wh and peak memory was 22,539 MiB of VRAM. Codex scored the change 100/100 against Syntalith's rubric. A model assigned the score from tests and criteria, without an external auditor.
Further tasks exposed missing CSV validation and a severe performance defect in a generated interface. This article collects both the successes and failures of the home experiment, which served one active model request at a time. Data: run summary, Go-task metrics, context test.
Model identity and the scope of this test
Qwen3.8-27B is a dense model with about 27 billion language-model parameters and a vision encoder. The official model card lists Apache 2.0 licensing and a native context of 262,144 tokens. Check the terms of the chosen weight package and dependencies before redistribution.
The producer describes text, image and video capabilities. This experiment covers the stated local configuration and recorded tasks. It does not validate every producer claim or multi-user throughput. Parameter count helps estimate resources; it does not replace quality evaluation on your own task.
Hardware and serving profile
| Component | Configuration |
|---|---|
| GPU | NVIDIA GeForce RTX 3090, 24 GB GDDR6X |
| Model | Qwen3.8-27B, dense, native 262,144-token context |
| Main weights | fast W4A16 AutoRound variant |
| Server | frozen third-party patched vLLM stack |
| Client | Qwen Code 0.21.13, medium effort |
| Context limit | 150,000 tokens |
| Context cache | FP8 KV |
| Decoding | MTP-3 |
| Simultaneous model requests | 1 |
This describes the complete profile. We also retained an llama.cpp fallback with Unsloth Dynamic V3 Q4_K_M GGUF weights and a 120k limit. The profiles changed weights, cache, server, decoding and context limit together, so timing differences cannot be attributed to one engine or quantisation alone.
Long-context retrieval
The test placed one exact fact near the beginning, one in the middle and one at the end of a synthetic record. The model had to return all three as JSON. Every run returned 3 of 3 checked values.
| Profile | Input tokens | Prefill | Generation | Wall time | Peak VRAM |
|---|---|---|---|---|---|
| 60k | 50,059 | 890.7 tokens/s | 49.24 tokens/s | 59.3 s | 22,287 MiB |
| 120k | 115,074 | 681.6 tokens/s | 40.46 tokens/s | 172.6 s | 22,649 MiB |
| 250k | 230,085 | 412.4 tokens/s | 28.05 tokens/s | 563.4 s | 23,623 MiB |
Prefill is the rate at which the server processes the input before generation. Generation speed measures newly produced answer tokens. Wall time covers the complete run, including input processing. This test checks retrieval of three planted facts. It does not measure comprehension of the whole document or repeatability.
The Go repair and its 100/100 score
The rubric assigned 40 points to error handling, 20 to regression tests, 15 to API compatibility, 10 to scope, 10 to verification and 5 to documentation. Two rerun test suites, go build ./... and a diff-format check passed.
100/100 means that Codex found no deduction against those criteria in this run. It is not a probability of success and does not cover every Go project. For comparison, the same local model with the 120k llama.cpp profile took 1,468.76 seconds, used an estimated 100.36 Wh and received 98/100. That compares complete serving profiles.
Everyday task log
| Task | Client | Time | Check result |
|---|---|---|---|
| CSV export | Qwen Code | 38.24 s | 3/3 public and 3/3 hidden |
| pagination | Qwen Code | 264.53 s | 3/3 public and 3/3 hidden |
| CSV import | Qwen Code | 93.14 s | 12/12 public, 4/5 hidden; blank name and role accepted |
| CSV import | Codex | 212 s | 11/11 public, 5/5 hidden |
| CSV import | OpenCode | 89.04 s | 9/9 public, 5/5 hidden |
Public tests are visible to the agent. Hidden checks cover conditions that the prompt or visible suite may leave implicit. The import result shows why a green public suite is insufficient for accepting a process.
ATS frontend: failure followed by repair
A one-sentence request from an empty directory produced an ATS panel in 26 minutes 3 seconds. The first version looked ambitious, yet its table virtualisation rendered 8,652 rows, 251,327 DOM elements and a 485,065-pixel document. The run stopped before complete browser QA because the client's heuristic classified progress as a loop.
The main repair took 14 minutes 24 seconds. Visual review and follow-up fixes took another 7 minutes 58 seconds. An independent desktop check measured 722 DOM nodes, 15 visible rows, a 900-pixel document and no horizontal overflow. Mobile had 577 nodes and 10 rows. Screenshot review still found a name/company collision and a clipped stage marker, so the next turn fixed two CSS rules.
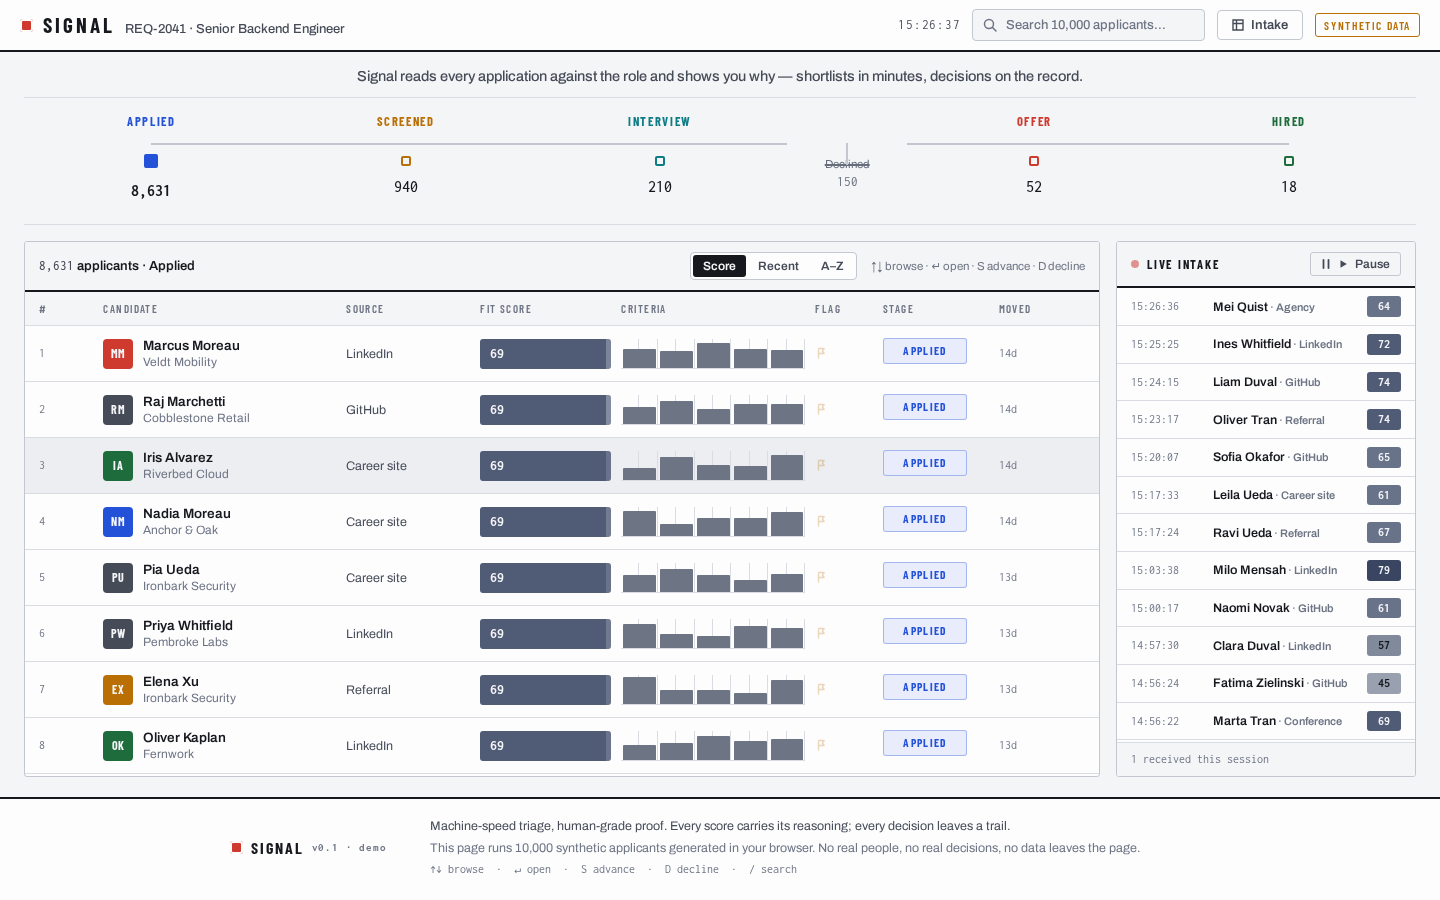
Total model time to the accepted variant was 48:25. This is a synthetic test interface rather than a client product.
Same model, different driver programs
We ran Qwen Code, the Codex harness and an experimental Claude Code path around the same local Qwen. Codex as evaluator awarded 100/100, 87/100 and 98/100 respectively. Local Qwen3.8-27B generated the code in every case. The client, repository workflow and context handling changed.
An evaluator is a program or model that applies explicit criteria to the resulting work. Here, Codex checked code, tests, build, scope and documentation. These scores do not compare Qwen with hosted OpenAI or Anthropic models. The Claude Code path used a compatible interface; Anthropic does not support routing Claude Code to non-Claude models.
What this says about deployment
One RTX 3090 may be enough for a pilot, one engineer or a sequential queue. A profile handling one active model request at a time cannot support a claim about simultaneous service for a team. Before deployment, measure peak demand, input and output lengths, queue time, human correction effort and behaviour after restarts or model updates.
The most useful test record contains the request, expected output, hidden checks, model version, serving profile and scoring method. Then compare the local model with a smaller model or an API.
Measurement limits
- Each configuration ran once.
- The long-context check covered three planted facts.
- The experiment used one GPU and handled one active model request at a time.
- The vLLM stack was third-party patched and frozen.
- Codex assigned the 100/100, 98/100 and 87/100 scores under the Syntalith rubric.
- The vLLM and
llama.cppcomparison changed weights, cache, engine and limits together.
The data remains available in the experiment summary. Syntalith helps businesses and individuals choose and run private models. We can test your tasks, select hosting or evaluate a smaller model. See the current Qwen, DeepSeek, Kimi and GLM guide for a broader shortlist.

Syntalith is an OpenAI Select Partner in the OpenAI Partner Network.
We help your team respond to customers faster and find information in company documents. We choose and set up the right AI tools, then teach your team how to use them.
How to introduce ChatGPT and OpenAI at workEvaluate private AI for your organization
We help businesses and individuals select hardware, deploy a model and test it on their own tasks. Start with a computer you already own or ask us before buying one. The first call is free; we price the work after reviewing the task and hardware.
Private LLMs and fine-tuning