Qwen Code: 26 minutes to a frontend, 48 to acceptance
An empty folder, one sentence and local Qwen on a home RTX 3090. The first ATS dashboard took 26:03. Here are the prompt, output and complete repair cost.
Syntalith
After 26 minutes and 3 seconds, Qwen Code had built a recruiting dashboard with search, sorting, hiring stages, candidate details and a mobile layout. We started from an empty folder and one sentence. Local Qwen3.8-27B generated the code on a home PC with an RTX 3090.
In the browser, the dashboard created 251,327 DOM elements and a page 485,065 pixels tall. A loop detector stopped the first session before complete interface checks. Two repair sessions brought it to the accepted test state, with total recorded model time of 48 minutes and 25 seconds.
Below are the prompt, screenshots and repairs. Applicant data is synthetic, and the experiment ran outside client work and production infrastructure.
The exact prompt
The model ran through Qwen Code at low reasoning effort with an advertised context capacity of 150,000 tokens. It received exactly this:
Build me a polished interactive frontend page for an AI recruitment/ATS product from scratch in this empty folder. I want to see what you can do in one shot. Use the Impeccable skill in overdrive mode, but keep it genuinely usable. Surprise me. Make it runnable locally, responsive, and finish and test it without asking me questions.
There was no wireframe, component list or existing visual system. The deliberately open request tested how much the model could design and implement independently. As a production brief, it would need DOM budgets, accessibility requirements and behaviour at realistic record volume.
What appeared after 26:03
Qwen created four main text files containing 2,028 lines of code and text and 79,588 bytes:
| File | Lines | Contents |
|---|---|---|
| PRODUCT.md | 47 | product concept and visual direction |
| index.html | 166 | dashboard structure |
| styles.css | 907 | layout, states, responsiveness and motion |
| app.js | 908 | data, filtering, virtualization and interactions |
The code generated 10,000 synthetic candidate records. The page filtered and sorted them, simulated incoming applicants, opened detailed records, changed hiring stages and updated pipeline counts. It also included keyboard shortcuts and reduced-motion handling.
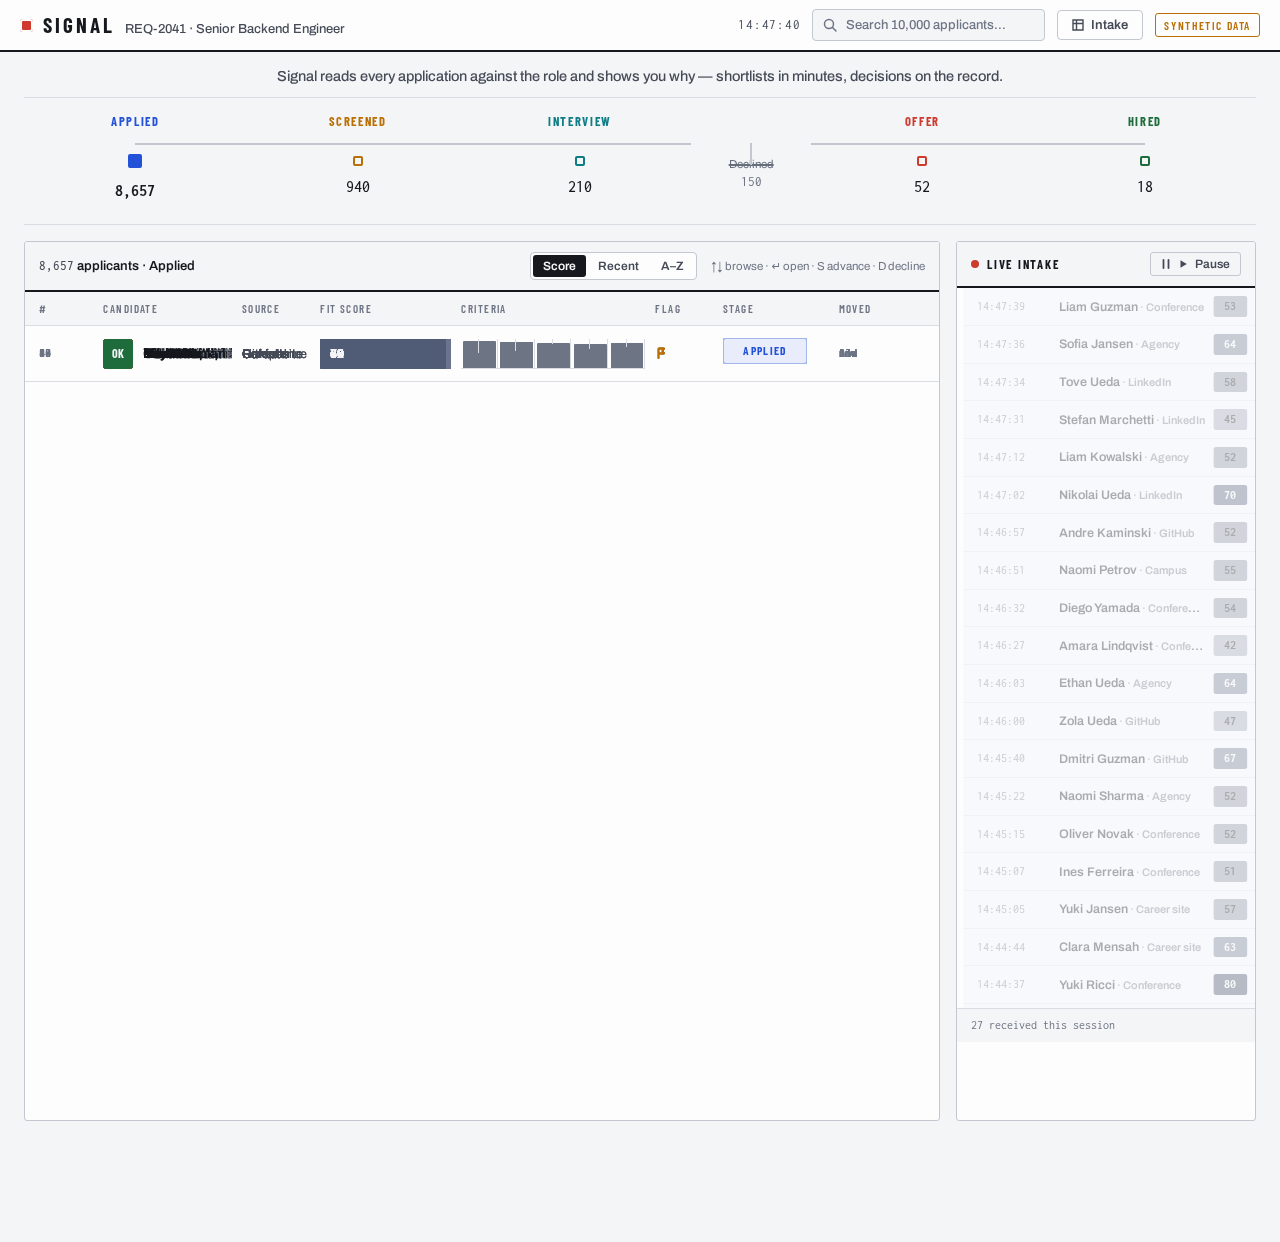
That is a useful first artifact from a deliberately open brief. We evaluate it by the result and time to acceptance, without turning one run into a claim about human productivity.
The complete timeline
| Stage | Profile | Time | Tool calls | End state |
|---|---|---|---|---|
| generation from scratch | Qwen Code low | 26:03 | 55 | frontend created, run stopped before QA |
| repair and browser QA | Qwen Code medium | 14:24 | 50 | six defects fixed |
| screenshot-driven polish | same medium session | 7:58 | 20 | two CSS fixes, desktop and mobile passed |
| total | 48:25 | 125 | result accepted after an independent browser check |
The table excludes the human time spent writing the request, inspecting the page and running independent checks. It covers the three recorded work stages. A tool call is one operation recorded by Qwen Code, such as reading a file, running a command or editing a file.
An earlier version of this article incorrectly said repair took longer than generation. The retained summaries show 22:22 of repair work versus 26:03 of generation. For planning, the useful figure is 48:25 of recorded run time to an accepted result.
Why the virtual list rendered everything
Qwen had attempted to virtualize the applicant list, keeping only visible records in the DOM. The design was reasonable, but two implementation details defeated it:
- the scroll viewport had no bounded height, so its clientHeight expanded to the height of the complete list;
- the calculated top position was assigned to a static list item while the inner row button was the absolutely positioned element.
The calculated visible window therefore contained all 8,652 matching applicants. The document reached 485,065 pixels in height. A normal full-page capture could finish only after the test browser temporarily constrained the layout.
The repair found four more defects
The second request was specific: preserve the design and interactions, reduce the element count, check desktop and mobile, and inspect the console. Qwen Code at medium effort took 14:24 from launch to completion. Alongside the two virtualization defects, it found four problems absent from the initial report:
| Defect | User-visible consequence |
|---|---|
| missing setDecisionButtons function | opening the drawer threw an exception |
| STAGES.indexOf(id) against an object array | advancing a candidate silently did nothing |
| the same lookup in history generation | earlier stages disappeared from the audit trail |
| an over-aggressive row-render shortcut | flags and stage changes did not refresh the row |
An independent Chromium pass then measured 722 DOM nodes and 15 visible rows on desktop, and 577 nodes with 10 rows at a 390-pixel width. The page fit its viewport and had no horizontal overflow.
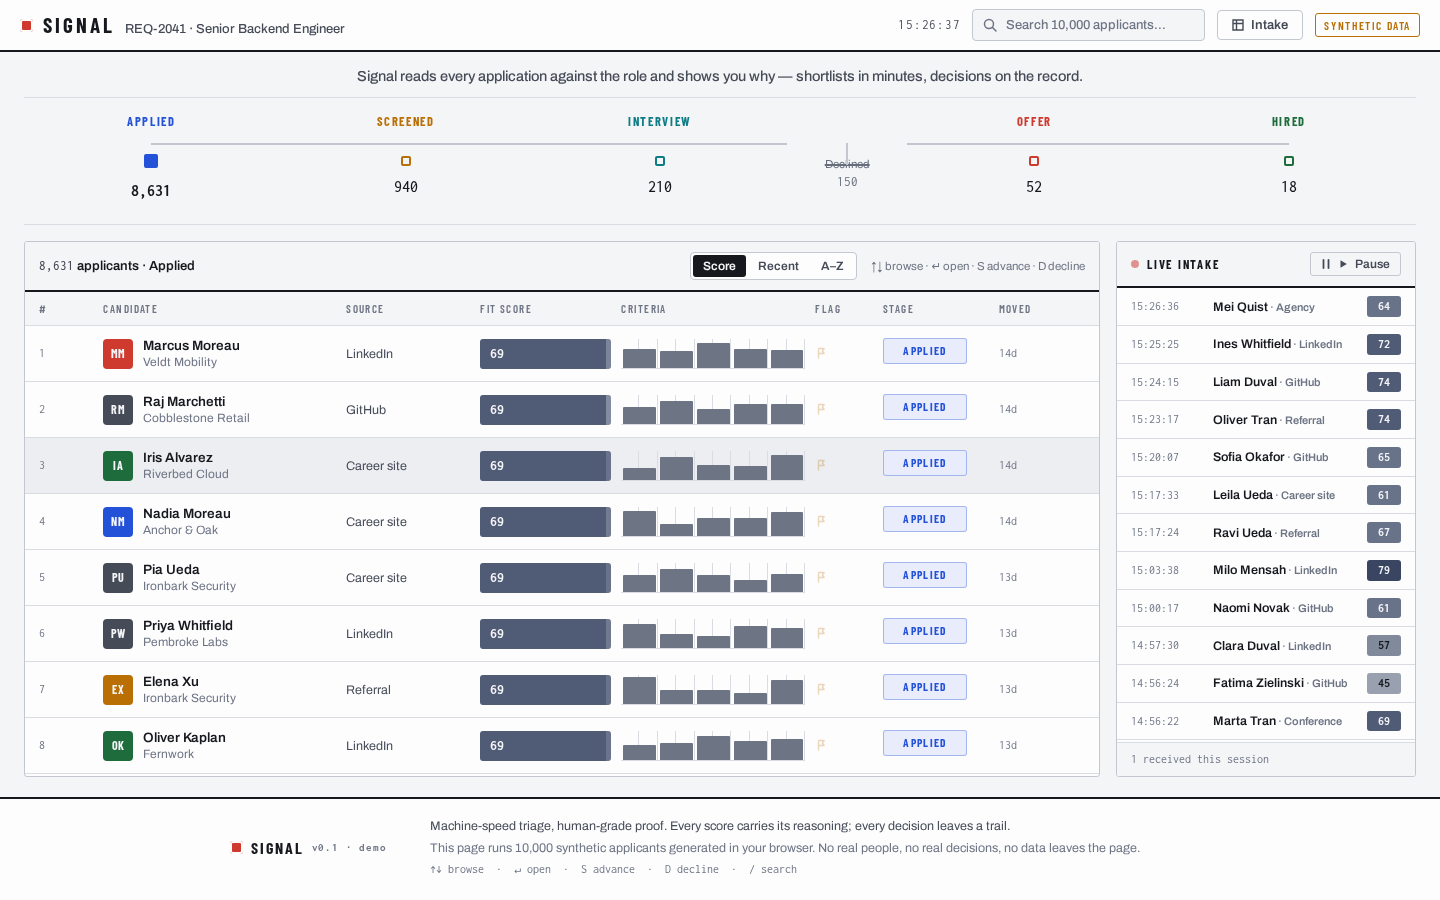
Geometry passed while the screenshot still looked wrong
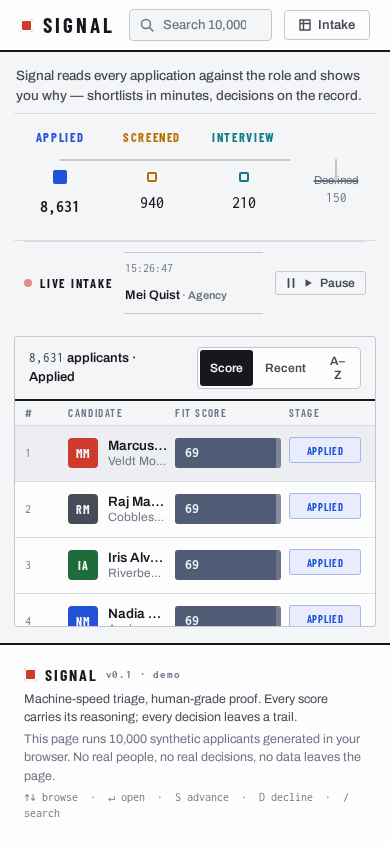
The automated check asked whether the rectangles for complete rows overlapped. It did not compare the candidate name and company label inside each cell. On mobile, the stage marker needed 72-84 pixels of width while its grid column was 51 pixels wide.
The third request named both visual defects. Qwen changed two CSS rules, but resuming the large session took 7:58 and 20 tool calls. The result was correct, while the session choice added overhead. A small independent change would fit better in a fresh session.
What Qwen actually demonstrated
Three capabilities were clear:
- it turned one sentence and an empty folder into a coherent interactive prototype;
- it traced a problem across CSS sizing, clientHeight, virtual-window calculation and element positioning in a 2,028-line artifact;
- while repairing the reported failure, it found four independent interaction and data defects.
The boundary was equally clear. The 26-minute result was useful for evaluating an idea, yet it was not ready for users. Acceptance required a 10,000-record workload, DOM measurements, interaction checks, console inspection and actual screenshots. Recorded model time nearly doubled.
This kind of agent is valuable when it quickly creates something a team can critique or takes a precise defect into an isolated copy. It still needs acceptance criteria and a reviewer willing to reject an attractive, broken result.
Already have an agent-generated prototype?
Syntalith can assess such a prototype in the same way: preserve the original, select one user journey, run it at realistic record volume, measure performance and interactions, then return a defect map and an agreed production scope.
If you want a local model for this work, we can select and deploy a profile with acceptance tests. For an existing prototype, an AI process audit can establish the scope for a custom AI application.
The full measured values from the other runs are in the public results summary. The direct client comparison is in Qwen Code, Codex, Claude Code and OpenCode on the same Qwen.

Syntalith is an OpenAI Select Partner in the OpenAI Partner Network.
We help your team respond to customers faster and find information in company documents. We choose and set up the right AI tools, then teach your team how to use them.
How to introduce ChatGPT and OpenAI at workEvaluate private AI for your organization
We help businesses and individuals select hardware, deploy a model and test it on their own tasks. Start with a computer you already own or ask us before buying one. The first call is free; we price the work after reviewing the task and hardware.
Private LLMs and fine-tuning